-1.jpg?width=276&height=100&name=APPA%20Logo%20R%204c%20(1)-1.jpg)
Getting Started
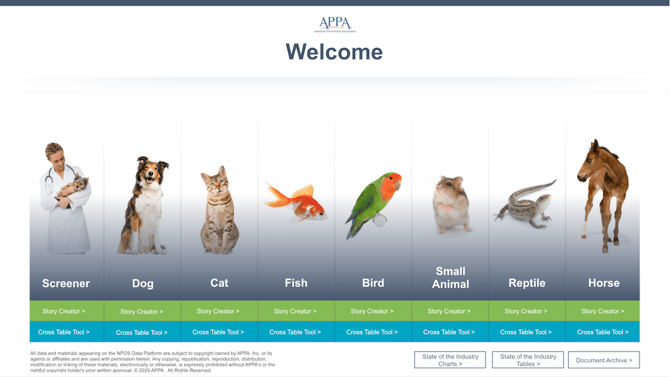
1. Log in to the NPOS Data Platform.
2. For screener or species-specific data, choose the Module you'd like to access and click on the blue Cross Table Tool button. For the State of the Industry data, select the State of the Industry Tables button in the lower right.
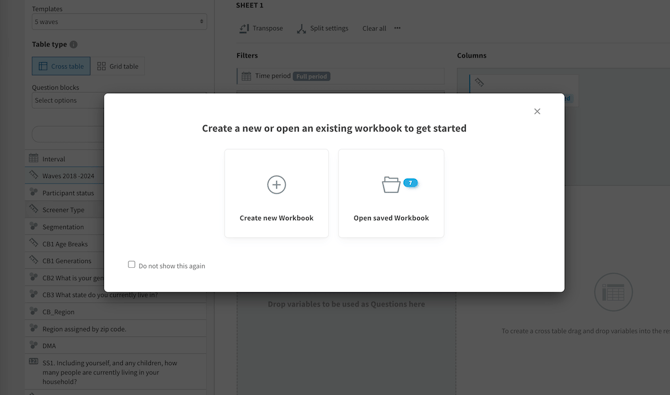
3. Create a new workbook or start from a saved workbook. Check the box if you'd like to skip this question in the future.
Data Query Setup
4. Select the data you'd like to analyze from the National Pet Owners Survey.
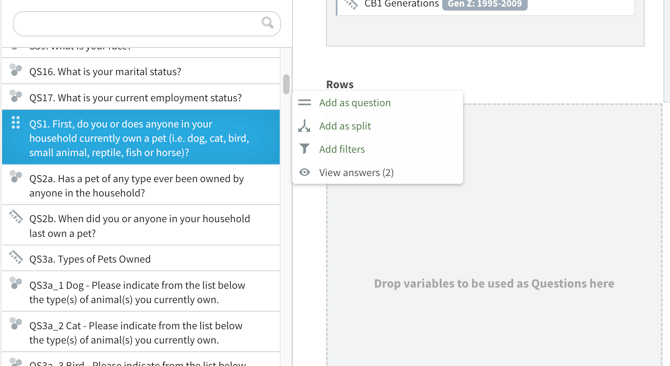
The center of the page is divided into three drop zones: Filters, Columns, and Rows.
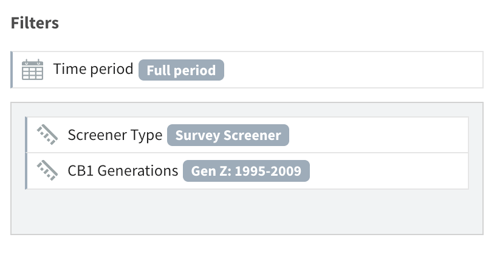
- Filters: Use this section to filter the data by time period or by data collected in the survey. By default, the survey screener is selected. You can add filters such as CB1. Generation to filter your results to focus on just Gen Z, for instance. To add a filter variable, click on a question from the work area's left column and select "Add filters."
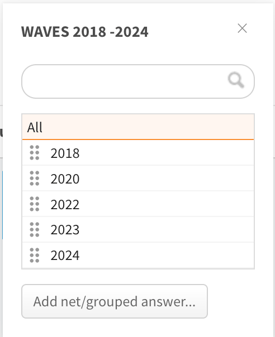
- Columns: Use this section to determine how you'd like to split your data. By default, Wave - Years are selected. Select all to include all available survey waves conducted starting in 2018. To add a new column variable, click on a question from the work area's left column then select "Add as split."
- Rows: Use this section to add the survey question you'd like to analyze. You can find all available questions in the work area's left column. You can drag-and-drop the question into this drop zone or click on it and select "Add as question."
5. Click Generate Table.
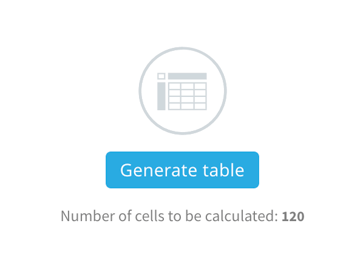
6. Now your table will load and you can move on to customizing how your data is displayed.
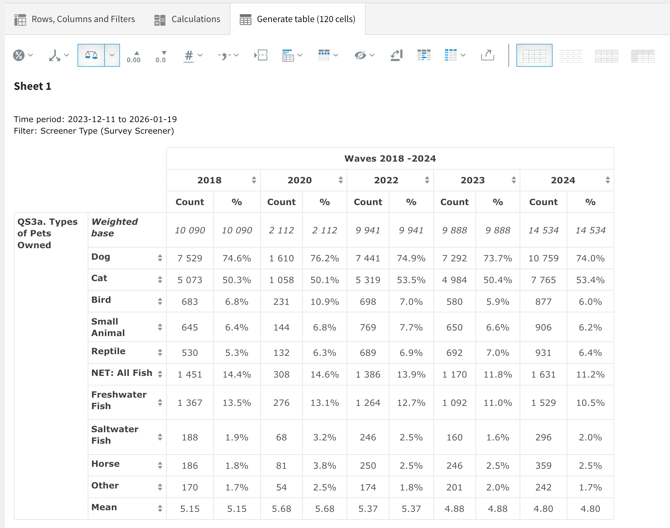
Adjust Settings in Calculations Tab
7. Click on Calculations at the top of the page to view and edit calculation settings for the following:
- Standard Calculations
- Weight the data
- Opt to display percentage share, mean, and count
- Edit which base is used for calculations
- Base Size
- Display base
- Enable warnings or hide low-base results
- Hide empty series
- Significance Testing
- Analysis type
- Significance level
- Positive, Negative or both
- Base size
- Comparison columns
- Base limit
- Where to show the result
- Benchmark
- Calculation
- Comparison columns and behavior
- Rank
- Rank direction
- Rank objects
- Display settings
- Compute Variables
- Create and edit computed variables
Finish and Save
8. When you're happy with your query and calculations, you can:
- Save your workbook within the platform
- Export to Excel
- Share with other users within the platform